FP&A · Controlling · Planning & Forecasting
Driver-Based FP&A Planning & Forecasting
An applied FP&A planning and reporting case for a multi-channel consumer electronics business under margin pressure. Revenue and units remain relatively resilient, but discounting, returns, marketing intensity, cost-to-serve pressure, and SG&A run-rate weaken margin conversion and push the full-year outlook below plan.
The core business tension:
the business keeps demand broadly close to plan, but fails to protect the economics of those sales.
Business problem
Revenue holds up, but margin conversion weakens.
This case is built around a realistic management problem: the business is not facing a simple sales miss. Units and revenue remain broadly resilient, but discounting, returns, marketing intensity, cost-to-serve pressure, and SG&A run-rate are weakening contribution quality.
The management question is more mature than “are sales down?”
A pure sales story would lead management toward a simple answer: push more volume. But that would miss the real issue. The business is still generating demand, yet it captures less profit from that demand because pressure builds below the top line.
The role of FP&A in this case is to explain where the profit gap opens, which drivers matter most, and what action should come before more commercial spend.
Questions management needs answered
- Where is profit conversion breaking down?
- Is the gap driven by volume, margin quality, or both?
- How does the Latest Forecast change the full-year outlook?
- Which management actions are most likely to protect profitability?
Build logic
A planning case first, a dashboard case second.
The workbook is the core FP&A logic and review layer. Power BI does not replace it. Power BI turns the same structured finance outputs into an executive reporting pack that is easier to scan, present, and discuss.
Excel workbook layer
Builds the planning structure: Budget, Actual, Latest Forecast, monthly P&L, YTD/FY review, driver interpretation, management commentary, and scenario sensitivity.
Power BI executive layer
Translates the finance logic into an executive reporting flow: performance diagnosis, P&L variance bridge, driver pressure ranking, and management recommendations.
Why this matters:
the project does not rely on a beautiful dashboard to look impressive. The credibility comes from the finance logic underneath it.
Workbook proof
The Excel layer shows the actual FP&A thinking.
These workbook views are important because they prove the project was built like a finance review pack: structured, version-aware, forward-looking, and management-facing.
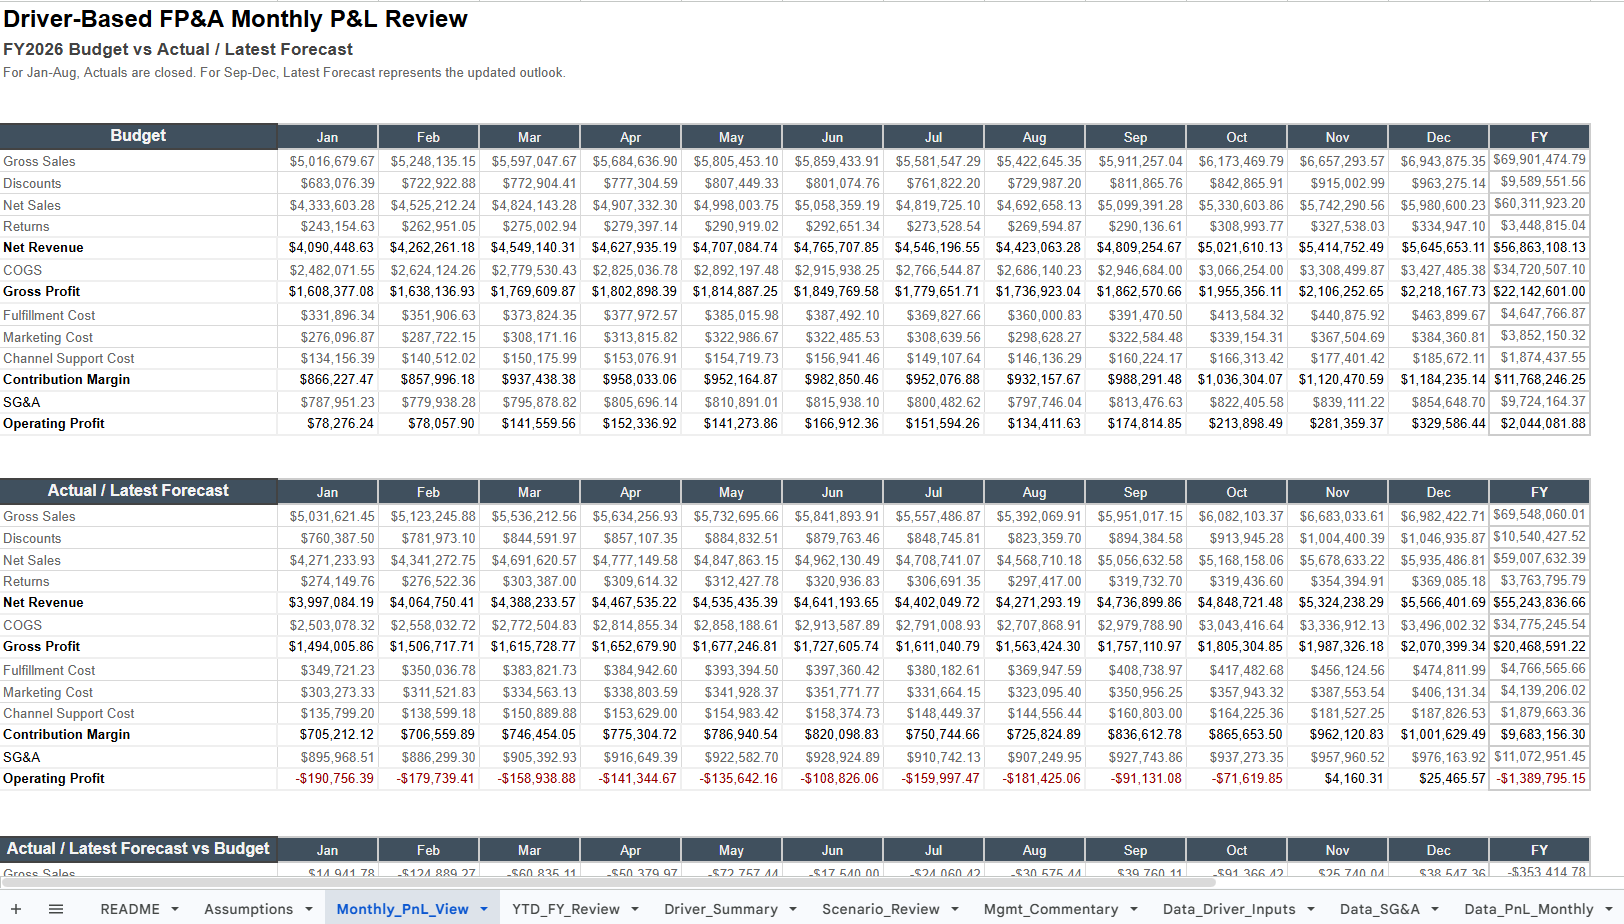
Monthly P&L View
Structures Budget, Actual / Latest Forecast, and variance versus Budget across the monthly P&L. This is the core finance review layer of the case.
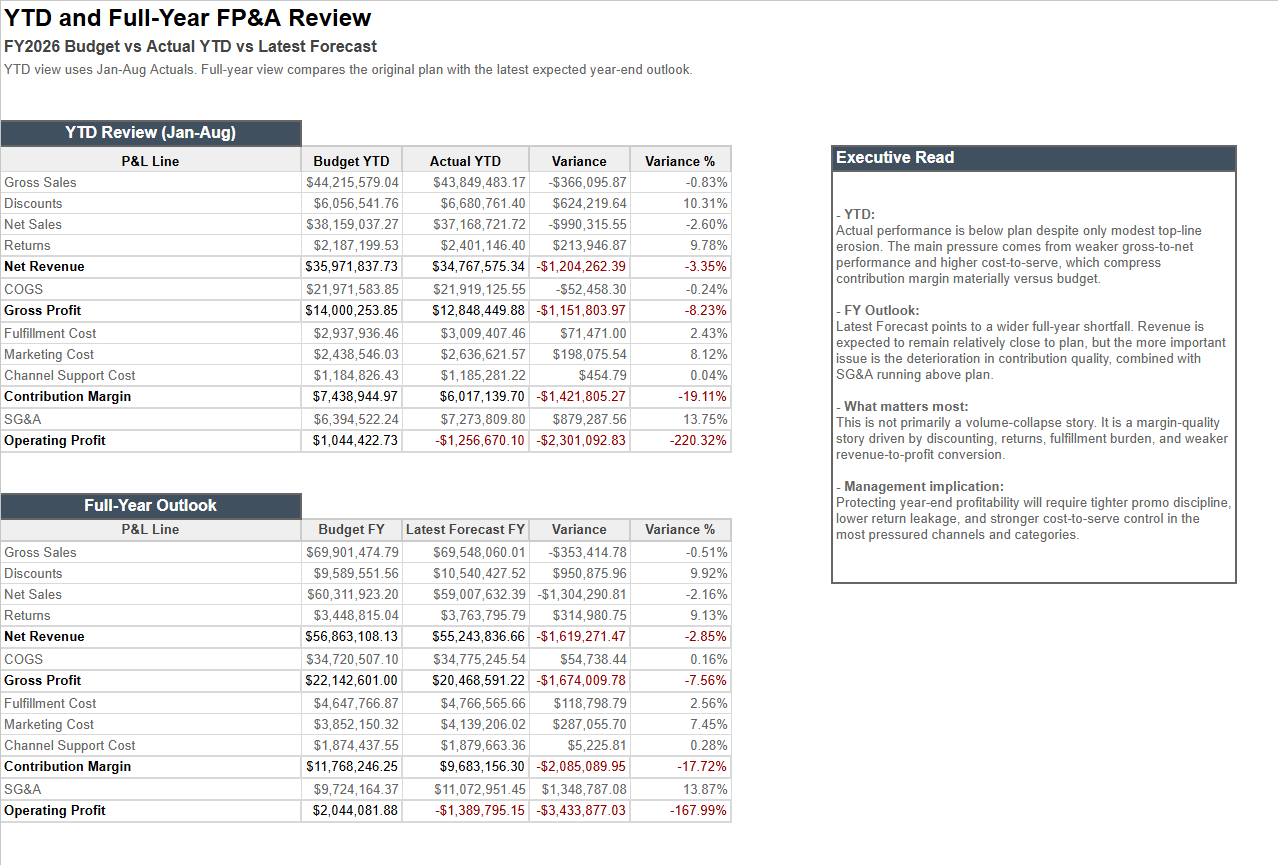
YTD / FY Review
Connects closed-month performance with the updated full-year outlook, helping management move from monthly tracking to forward-looking judgement.
Driver Summary
Links the financial shortfall to units, pricing, discount rate, return rate, fulfillment cost per unit, marketing rate, and channel support cost.
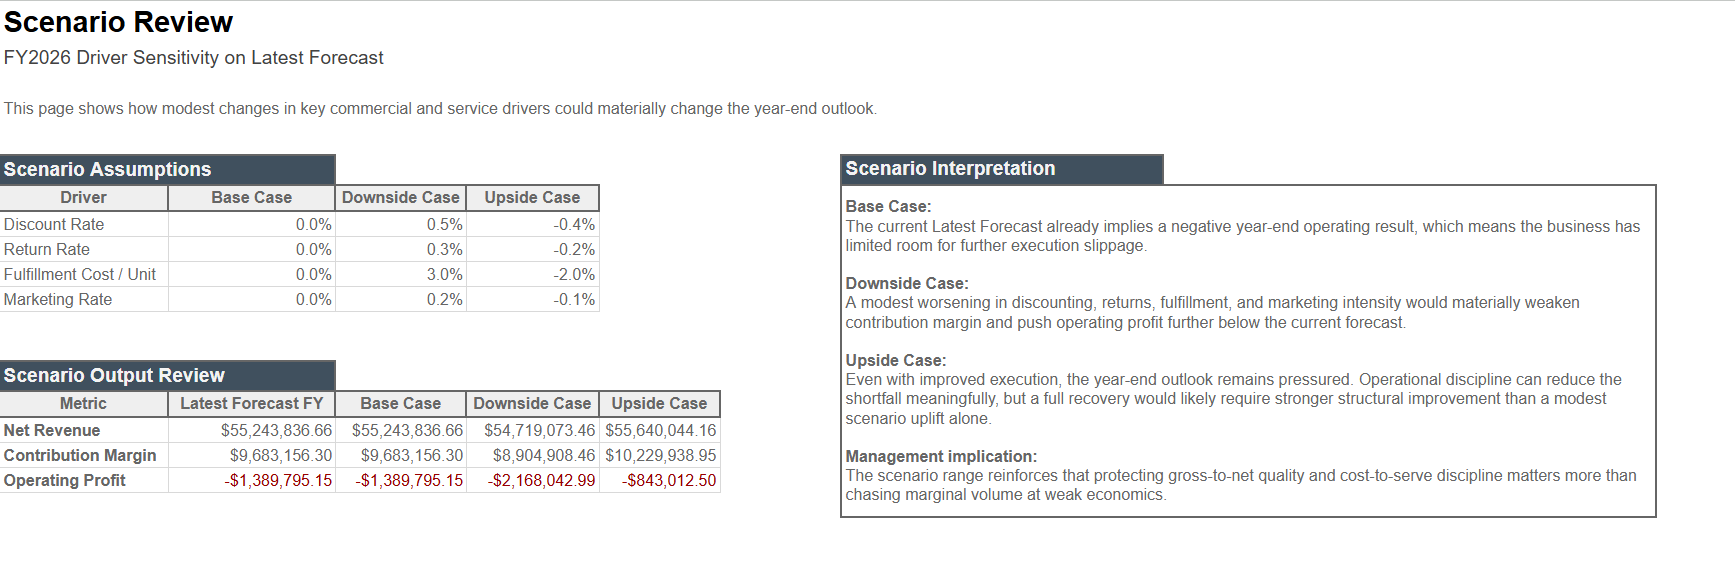
Scenario Review
Adds lightweight sensitivity thinking around discounting, returns, fulfillment cost, and marketing intensity to understand how the year-end outlook could move.
Executive reporting story
Three pages, three different management questions.
The Power BI layer is intentionally short. Each page earns its place: one frames the business issue, one explains where the P&L breaks, and one translates the variance into operating drivers and next actions.
Page 1
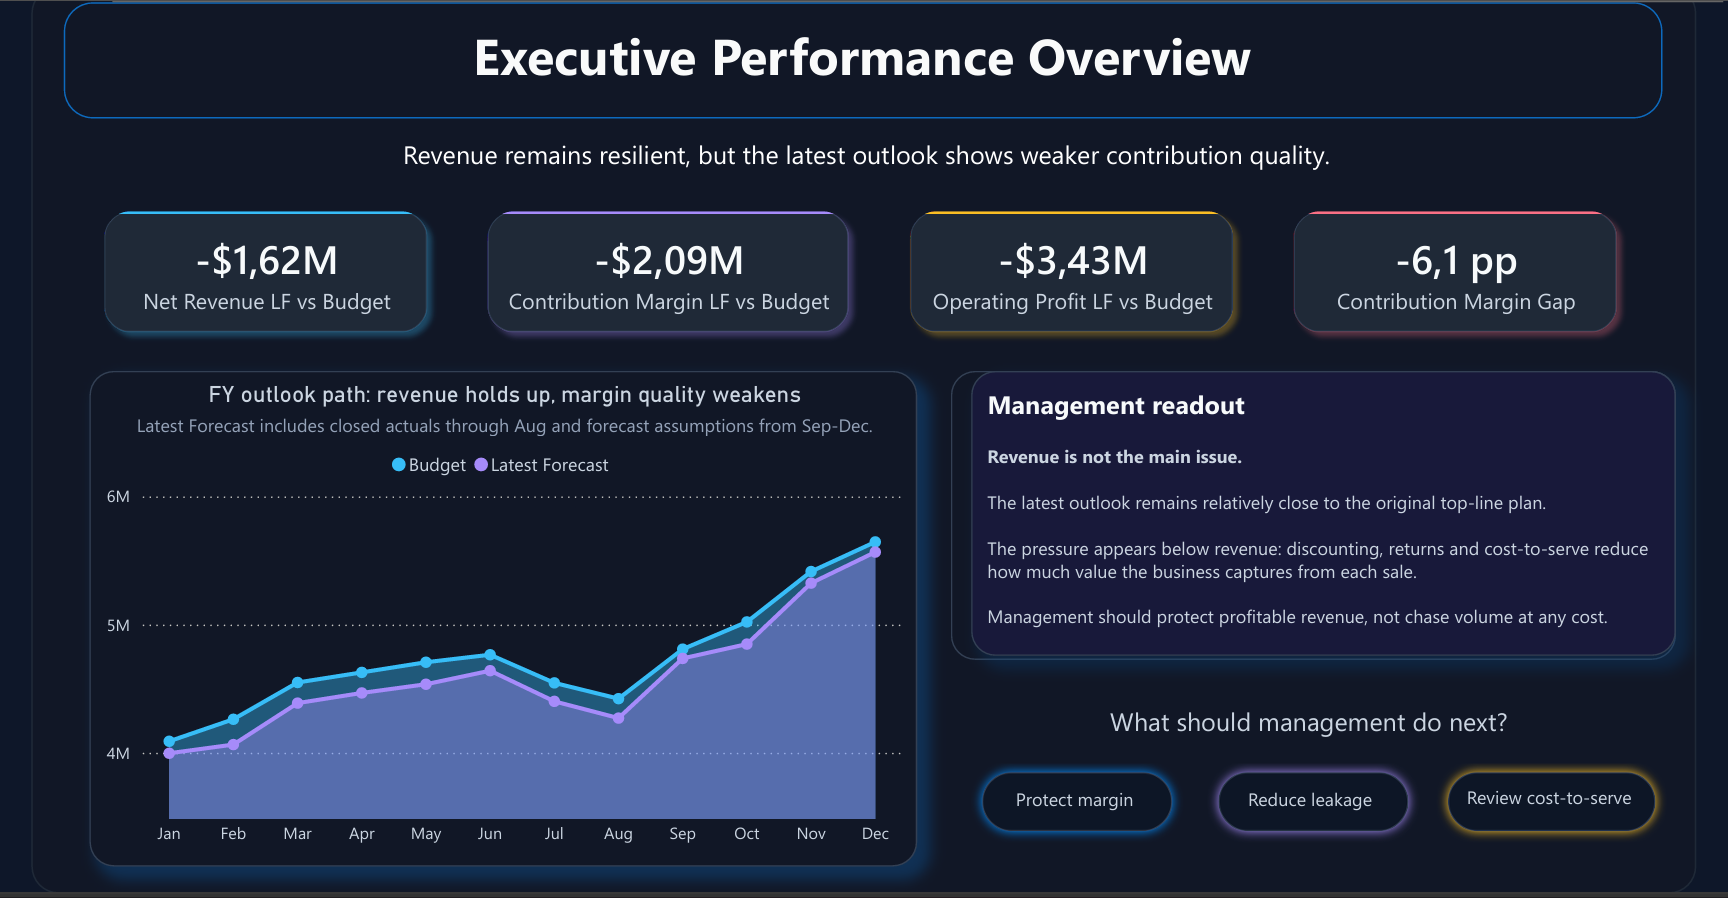
Executive Performance Overview
Are we below plan, where is the pressure visible, and what should management care about first?
This page gives the executive diagnosis. Revenue and units remain relatively resilient, but the Latest Forecast shows weaker margin conversion and a worse operating profit outlook.
Management takeaway
Revenue does not collapse. The issue is that the business captures less value from broadly stable demand.
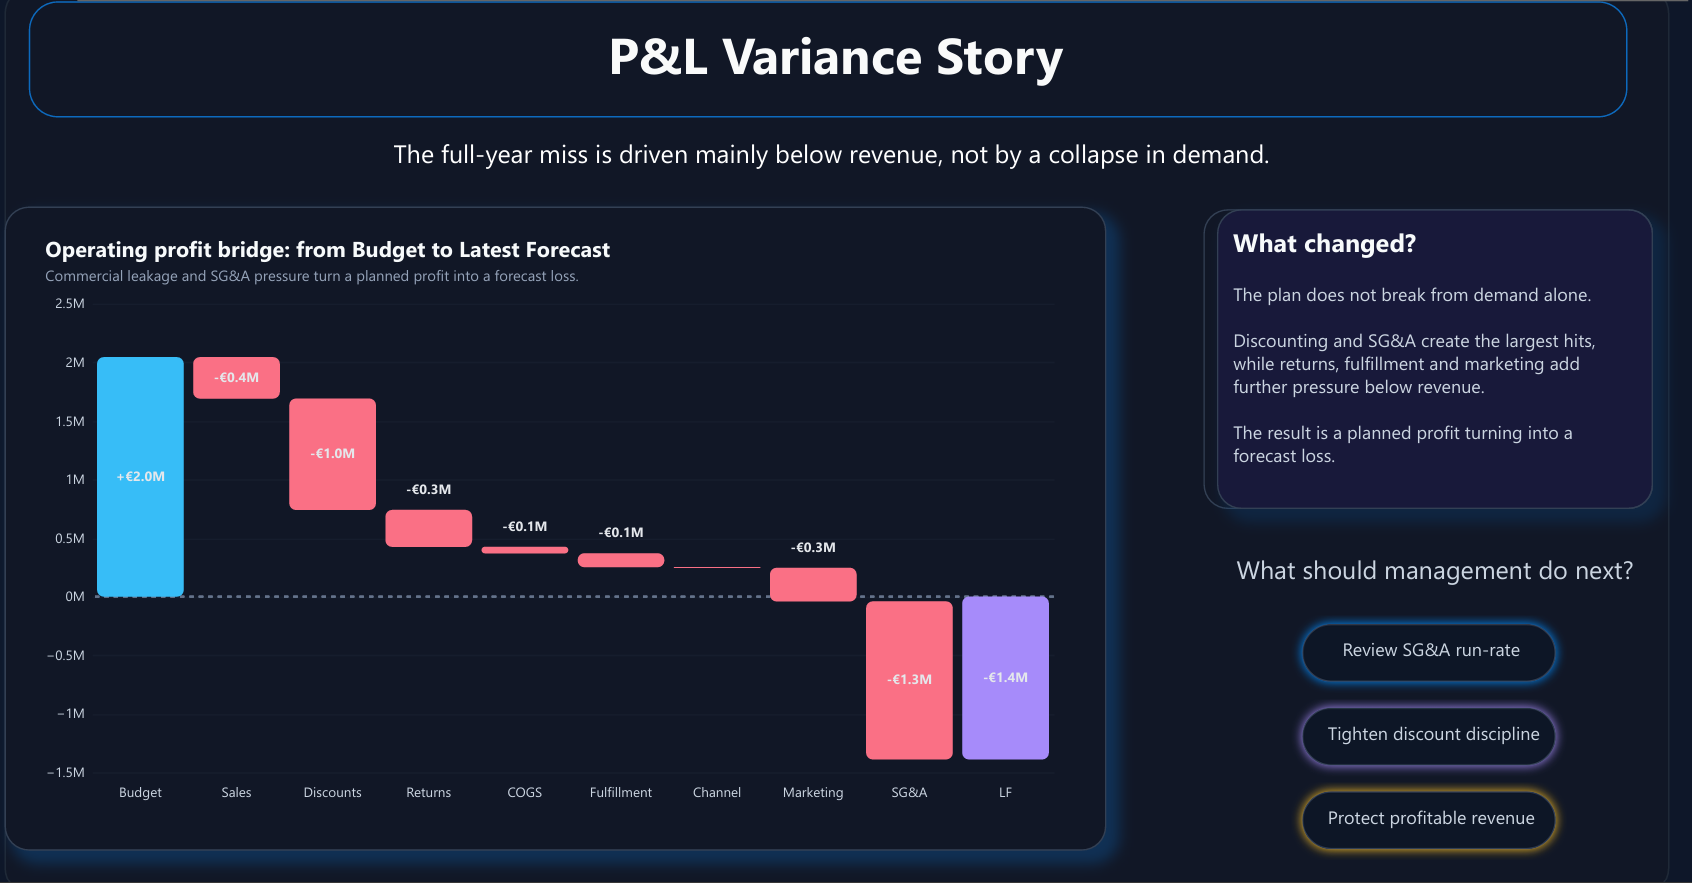
Page 2
P&L Variance Story
Where exactly did the full-year plan break across the P&L?
This is the strongest FP&A / Controlling page. The bridge shows how the business moves from planned profit to forecast loss through discounting, returns, marketing, SG&A, and cost pressure below revenue.
Management takeaway
The full-year miss is driven mainly below revenue, where commercial leakage and SG&A pressure turn planned profit into forecast loss.
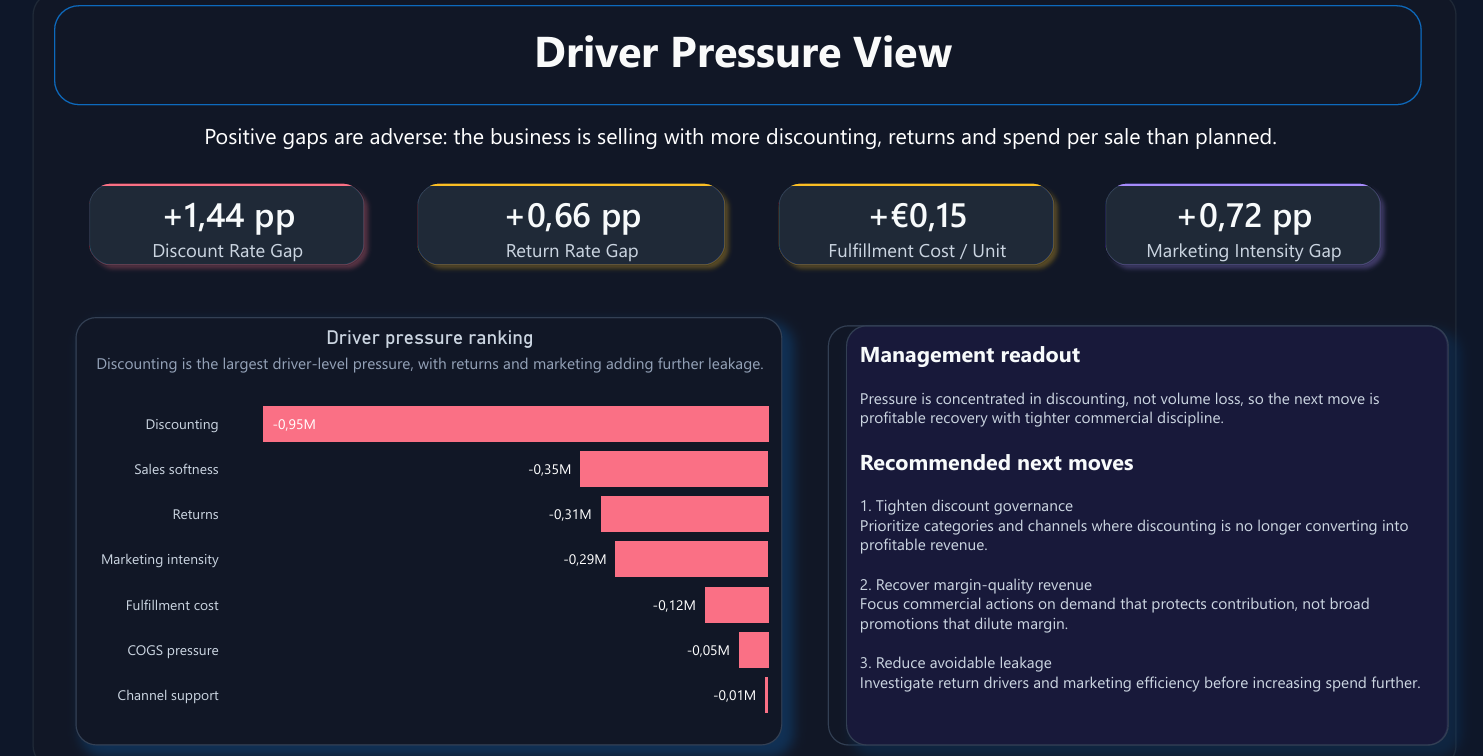
Page 3
Driver Pressure View
Is the pressure mainly coming from volume, discounting, returns, marketing intensity, or cost-to-serve?
The closing page connects financial variance to operating drivers. Discounting is the largest driver-level pressure, with returns, marketing intensity, fulfillment cost, and a smaller sales gap adding further leakage.
Management takeaway
The right response is not volume at any cost. Management needs profitable recovery with tighter commercial discipline.
Key insights
The case is really about profit quality.
The strongest insight is not that the business is below plan. It is why. The reporting pack separates top-line resilience from weaker contribution quality.
The business is not simply missing sales. Demand remains relatively resilient, but the economics of those sales are weaker.
Discounting is the clearest driver-level pressure, which makes commercial discipline more important than broad promotional recovery.
Contribution Margin is the key line in the story because it shows the gap between top-line resilience and weaker profit conversion.
The workbook gives the project its FP&A credibility; Power BI turns the same logic into a faster executive reporting layer.
Recruiter-facing value
Why this project strengthens my FP&A / Controlling positioning.
This project is designed to show the part of analytics that hiring managers actually care about in FP&A and controlling roles: structure, judgement, business mechanics, reporting discipline, and action orientation.
Finance-facing analysis
The case is built around planning logic, P&L structure, forecast review, and management commentary rather than generic KPI exploration.
Business diagnosis
It separates demand resilience from margin-quality deterioration, which is exactly the kind of judgement expected in FP&A and controlling work.
Decision support
The final output does not stop at variance explanation. It translates the pressure into actions around discount governance, margin-quality revenue, and leakage reduction.
Tools and skills
Practical finance analytics stack.
The toolset stays intentionally close to real FP&A work: Excel for planning logic, Power BI for executive reporting, and structured outputs to keep the model clean and reusable.
ExcelPower BIDAXDeneb custom visualPower Query mindsetCSV reporting outputsFP&A modellingVariance analysisDriver-based reportingScenario sensitivityManagement commentaryExecutive storytelling
Portfolio takeaway
Finance logic, driver diagnosis, and executive reporting in one case.
This project shows how a business can stay relatively resilient on revenue while still missing plan on profit because discounting, returns, marketing intensity, cost-to-serve pressure, and SG&A run-rate weaken contribution quality.