Data Science & Business Analytics
Data Science · Business Analytics · Data Analytics
Turning data into business decisions.
Applied analytics, decision support, and business-facing data projects built around real commercial, operational, finance, and healthcare use cases.

Latest academic achievement
Applied analytics and decision-support focus
About me
Analytics with business context.
I build business-facing analytics that turn operational, commercial, and financial data into clearer decisions, structured visibility, and more useful reporting.
My background combines a recent Master’s in Data Science and Business Analytics with a practical interest in how companies actually make decisions: what management needs to see, which risks are hidden in the data, and where reporting or modelling can remove friction.
I am especially interested in projects where data is not only explored, but translated into tools, decision-support systems, and outputs that non-technical stakeholders can understand, trust, and use in real workflows.
Across my portfolio, I focus on the space between business analysis, data analytics, and applied Data Science: clarifying the problem first, validating the data, building the right analytical layer, and communicating the result in a way that supports action.
Selected work
Applied analytics projects built around real business decisions.
Explore the portfolio by role positioning. Each case is designed to show how I use data to clarify problems, diagnose drivers, and support management action.
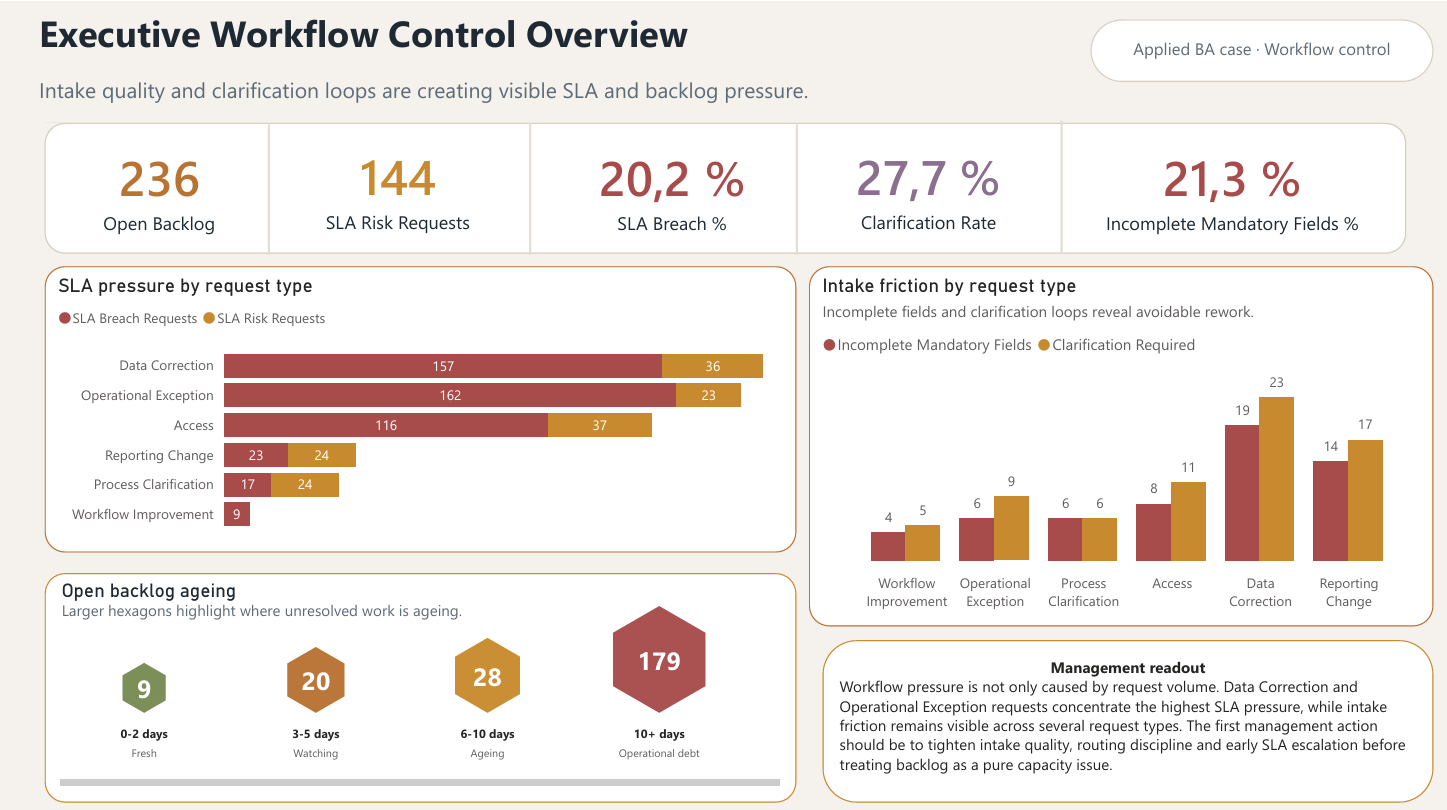
Business Analysis / Workflow Control / Process Improvement New BA workflow case
Service Request Workflow Control & Prioritisation
A Business Analyst case showing how fragmented internal service request intake can be translated into structured requirements, validation rules, workflow controls, KPI reporting, and prioritised management action.
Business AnalystData Analyst / BI
AS-IS / TO-BE workflowRequirements + UAT logicPower BI action prioritisation
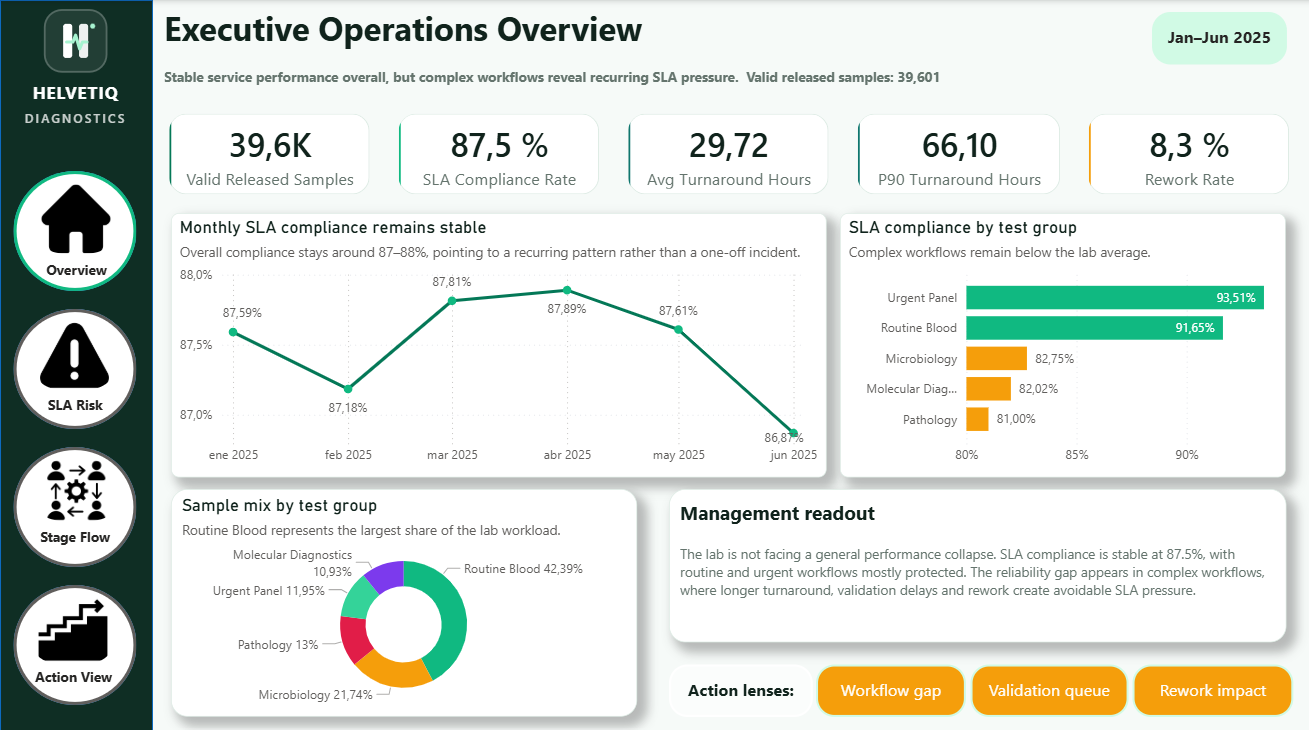
Healthcare Analytics / SLA / Operations New healthcare analytics case
Diagnostic Lab Performance & SLA Analytics
Operational analytics case for a diagnostic lab network, focused on SLA reliability, workflow bottlenecks, rework impact, and site-level quality action prioritization.
Data Analyst / BIBusiness Analyst
40K sample recordsSQL + Power BI modelSLA + bottleneck actions
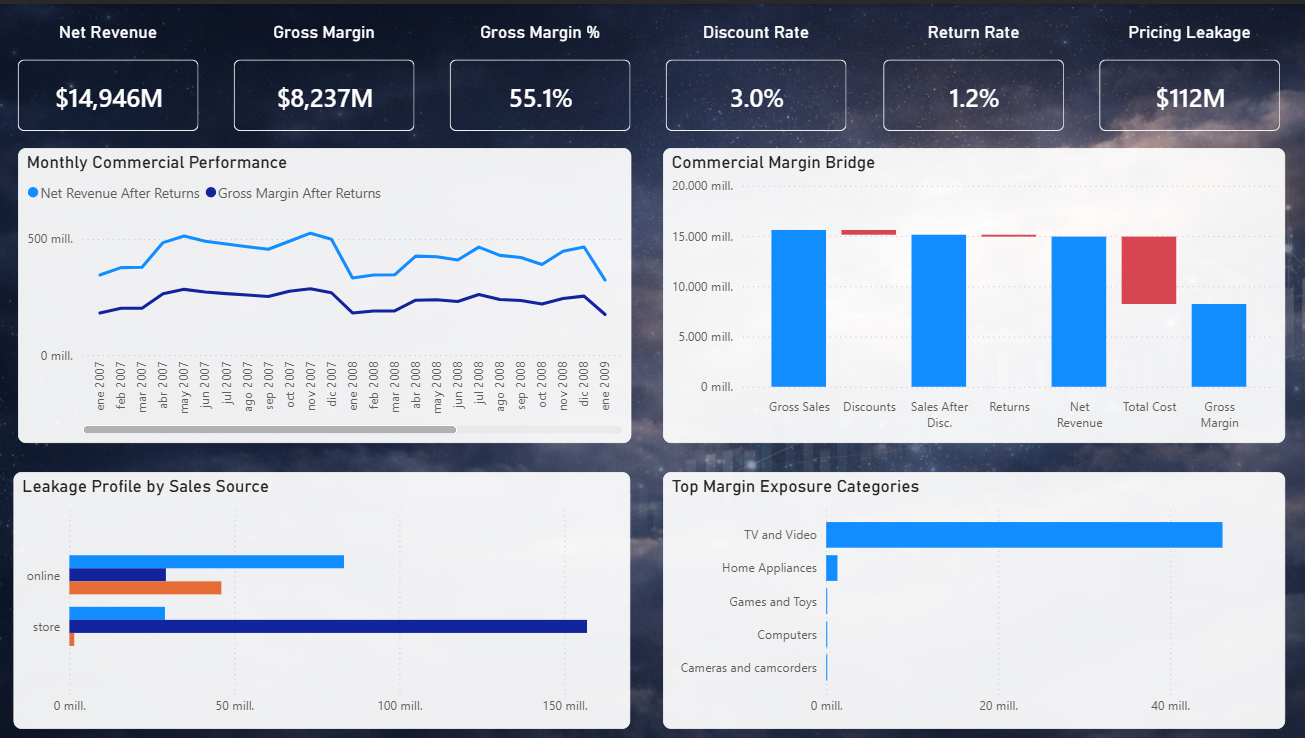
Commercial Analytics / Pricing / Margin Management-facing case
Commercial Margin Protection & Pricing Analytics
A business-facing analytics case focused on discount leakage, returns, weak price realization, and margin pressure in an omnichannel retail business.
Data Analyst / BIBusiness AnalystFP&A / Controlling
5-page Power BI suitePricing + returns + margin logicAction prioritization
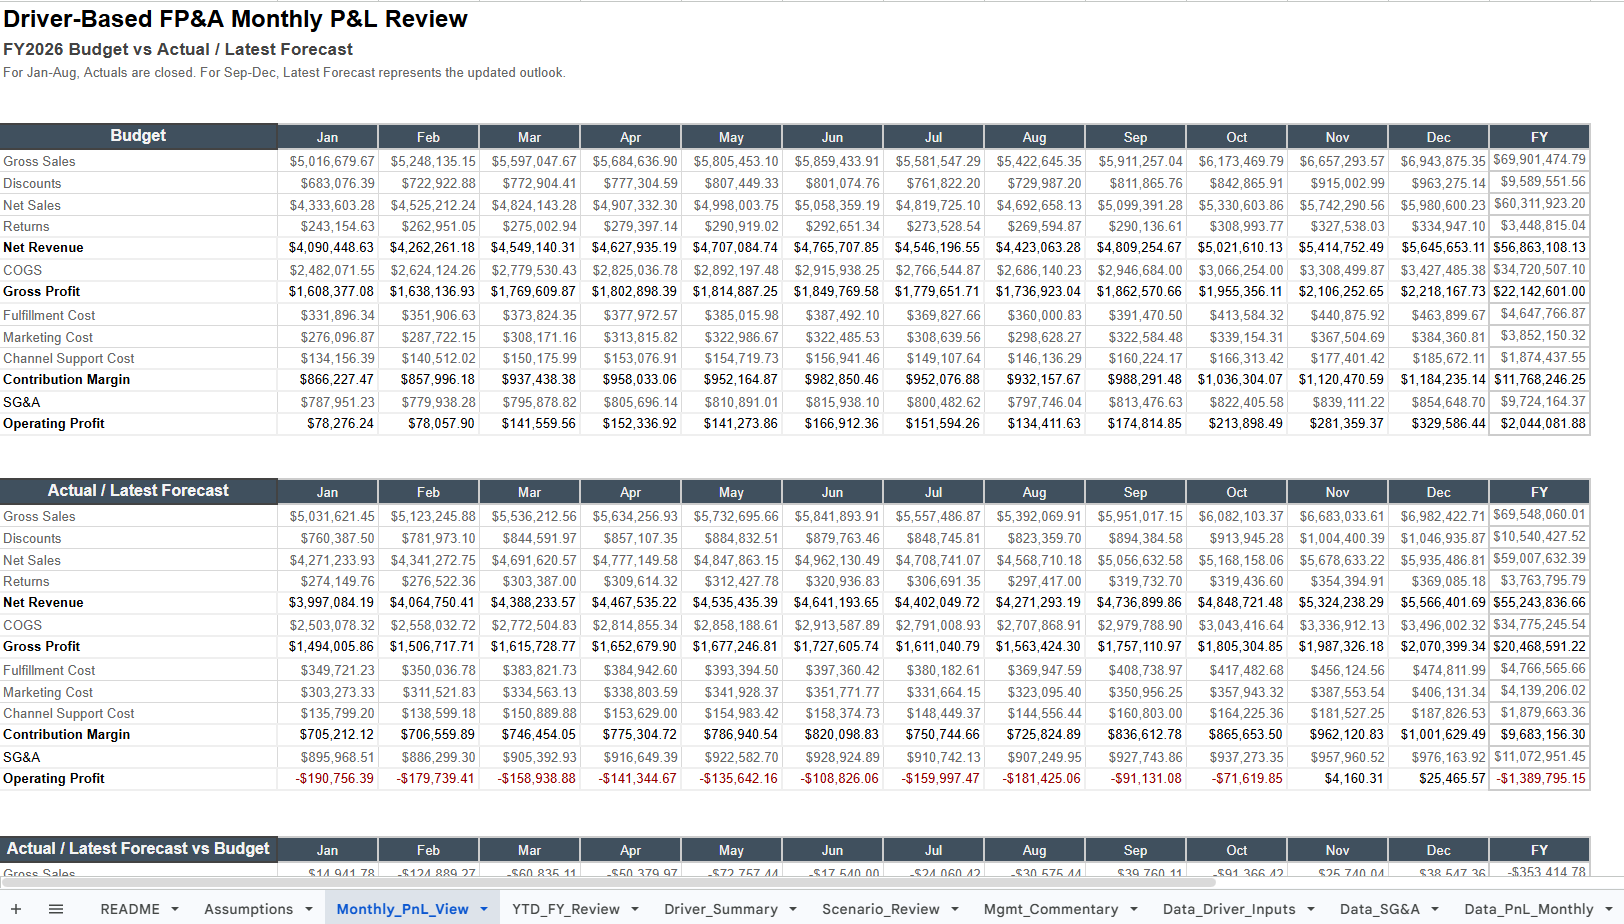
FP&A / Controlling / Planning & Forecasting FP&A case
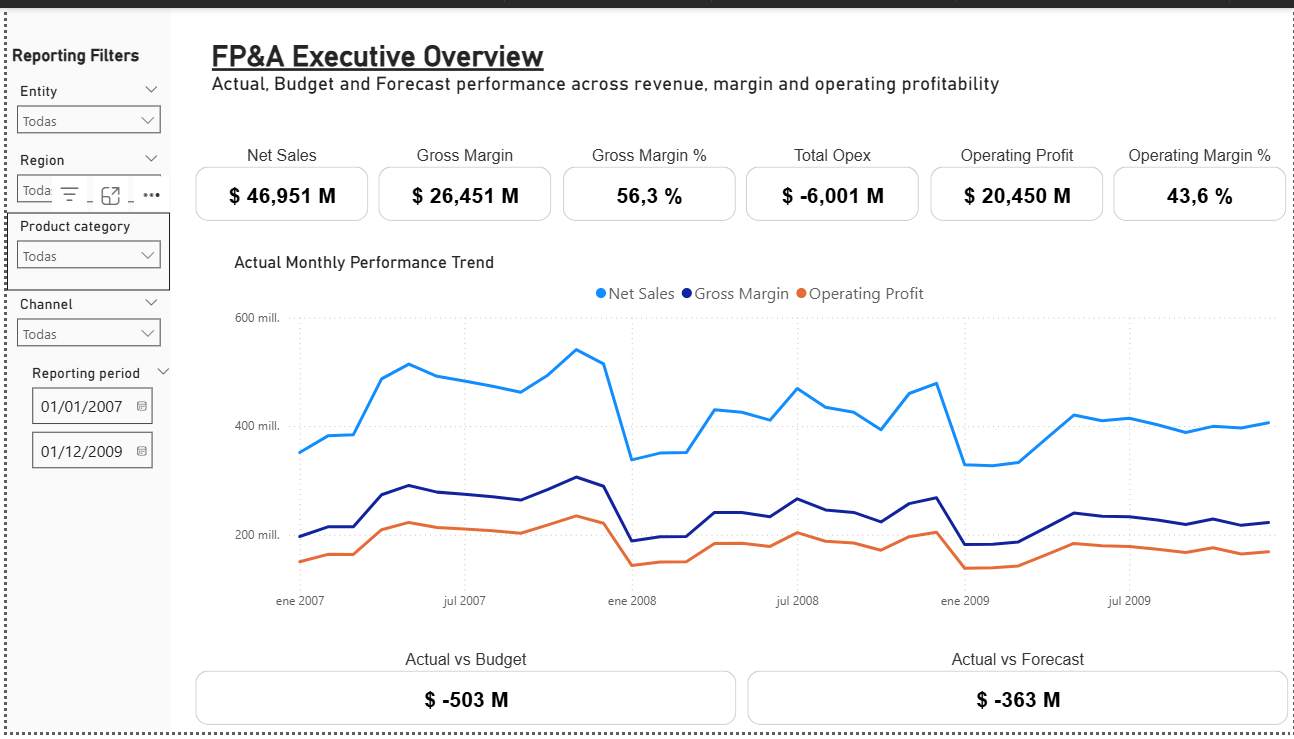
Driver-Based FP&A Planning & Forecasting
Driver-based FP&A planning and Power BI reporting case showing how stable demand can still translate into weaker profitability when discounting, returns, and cost-to-serve pressure build below revenue.
Data Analyst / BIBusiness AnalystFP&A / Controlling
Budget / Actual / LFExcel FP&A packP&L variance story
Manufacturing / Controlling / Cost-to-Serve Operations controlling case
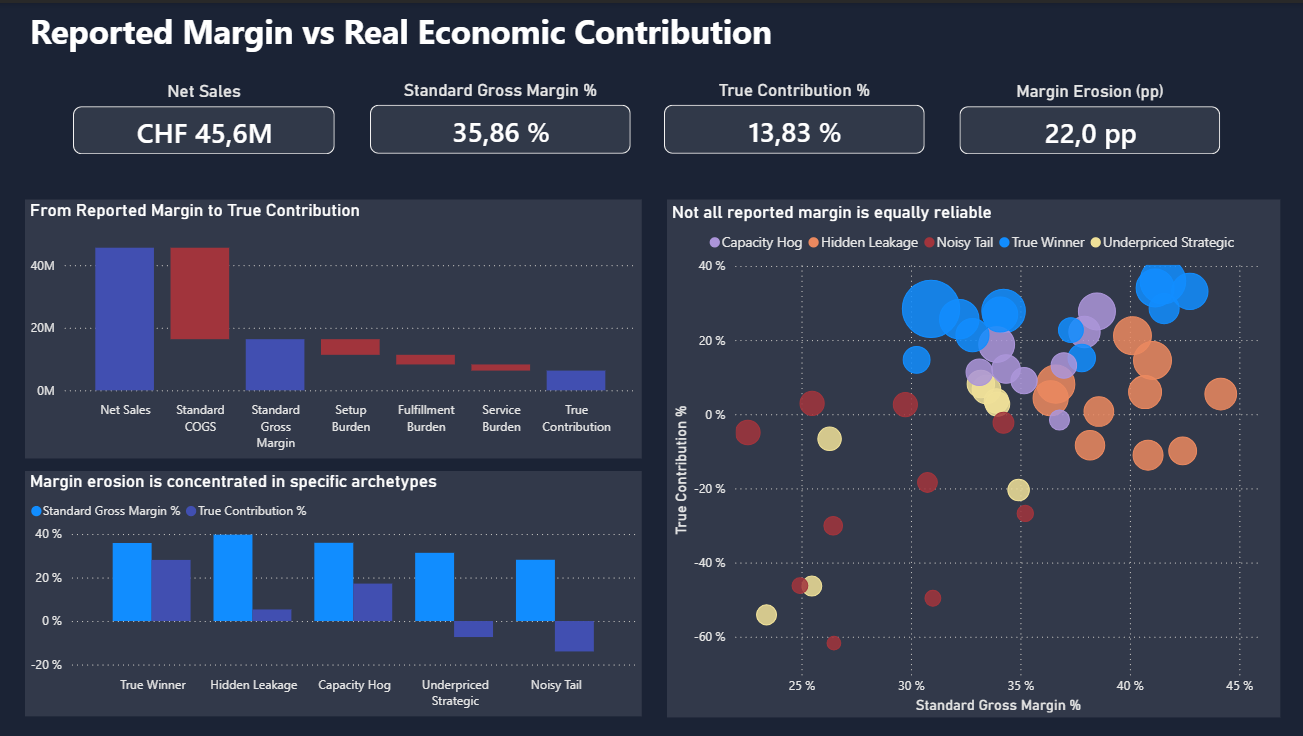
Manufacturing / Operations Controlling & Cost-to-Serve
A management-facing controlling case built around a harder profitability question: which products still create real value once setup effort, fragmentation, fulfillment burden, service support, and scarce capacity are taken seriously?
Data Analyst / BIBusiness AnalystFP&A / Controlling
4-page decision flowProfitability vs operational burdenManagement action logic
Finance / FP&A / Controlling Finance data case
Finance Data Foundation for FP&A and Controlling
Finance-focused analytics project designed to demonstrate source-to-target logic, variance analysis, reconciliation controls, and stakeholder-facing reporting.
Data Analyst / BIBusiness AnalystFP&A / Controlling
4-page Power BI suiteVariance & controlsDuckDB + parquet layers
Product Analytics / Experimentation / Growth Product analytics case
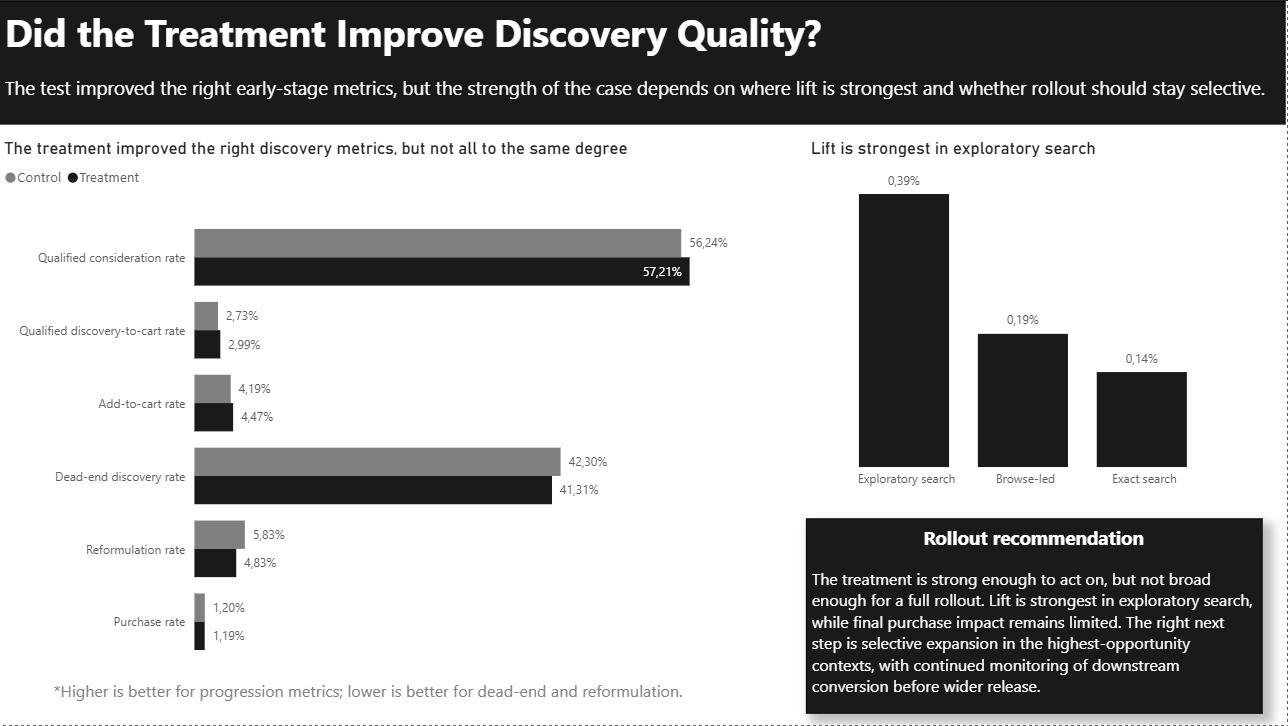
NovaMarket — Product Growth & Experimentation Analytics
A product analytics case built around a real marketplace question: did a new discovery treatment improve user progression enough to justify selective rollout?
Data Analyst / BIBusiness Analyst
4-page Power BI storyExperiment-aware analysisSelective rollout decision
Master’s flagship project
End-to-end decision-support system for SMEs
A full analytical system turning fragmented commercial data into structured visibility, segmentation, recommendation logic, and business-facing outputs.
Data Analyst / BIBusiness AnalystData Science / AI
Multi-source pipelineSegmentation + recommendationsDecision-support design
Applied ML / Insurance Analytics / Human-in-the-loop AI New ML triage case
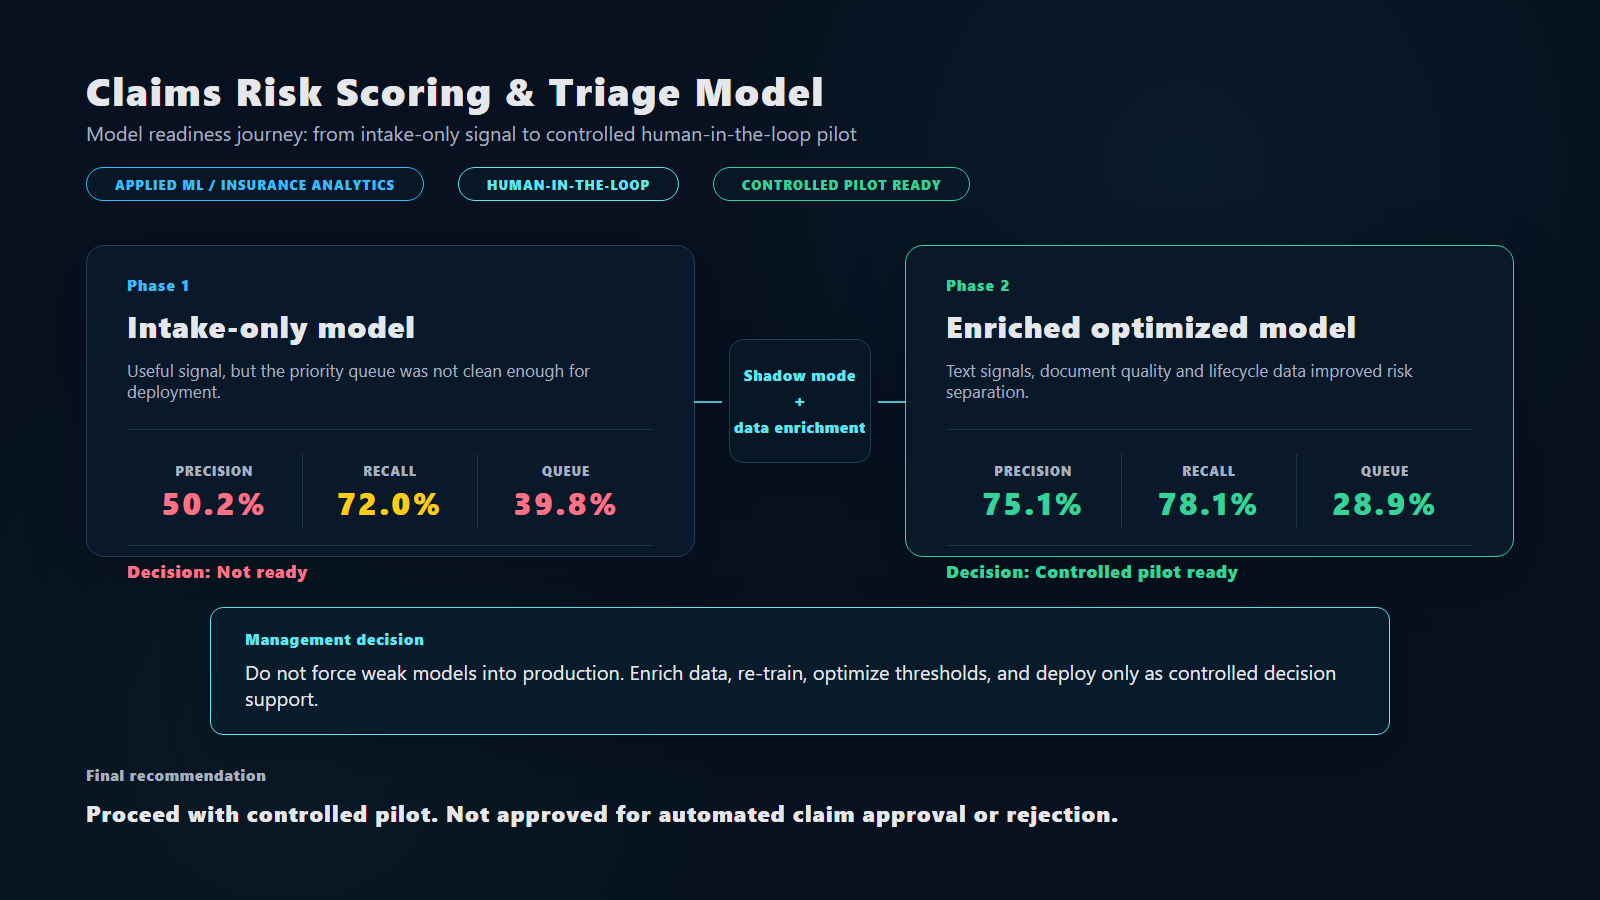
Claims Risk Scoring & Triage Model
An applied ML case showing how a claims triage model moved from an intake-only baseline that was not deployment-ready to an enriched, explainable, human-in-the-loop pilot with threshold policy, watchlist logic, and monitoring controls.
Data Science / AIBusiness Analyst
Optimized Gradient BoostingLLM-style text enrichmentPilot readiness + monitoring
AI Reliability / LLMOps / Governance Flagship AI case
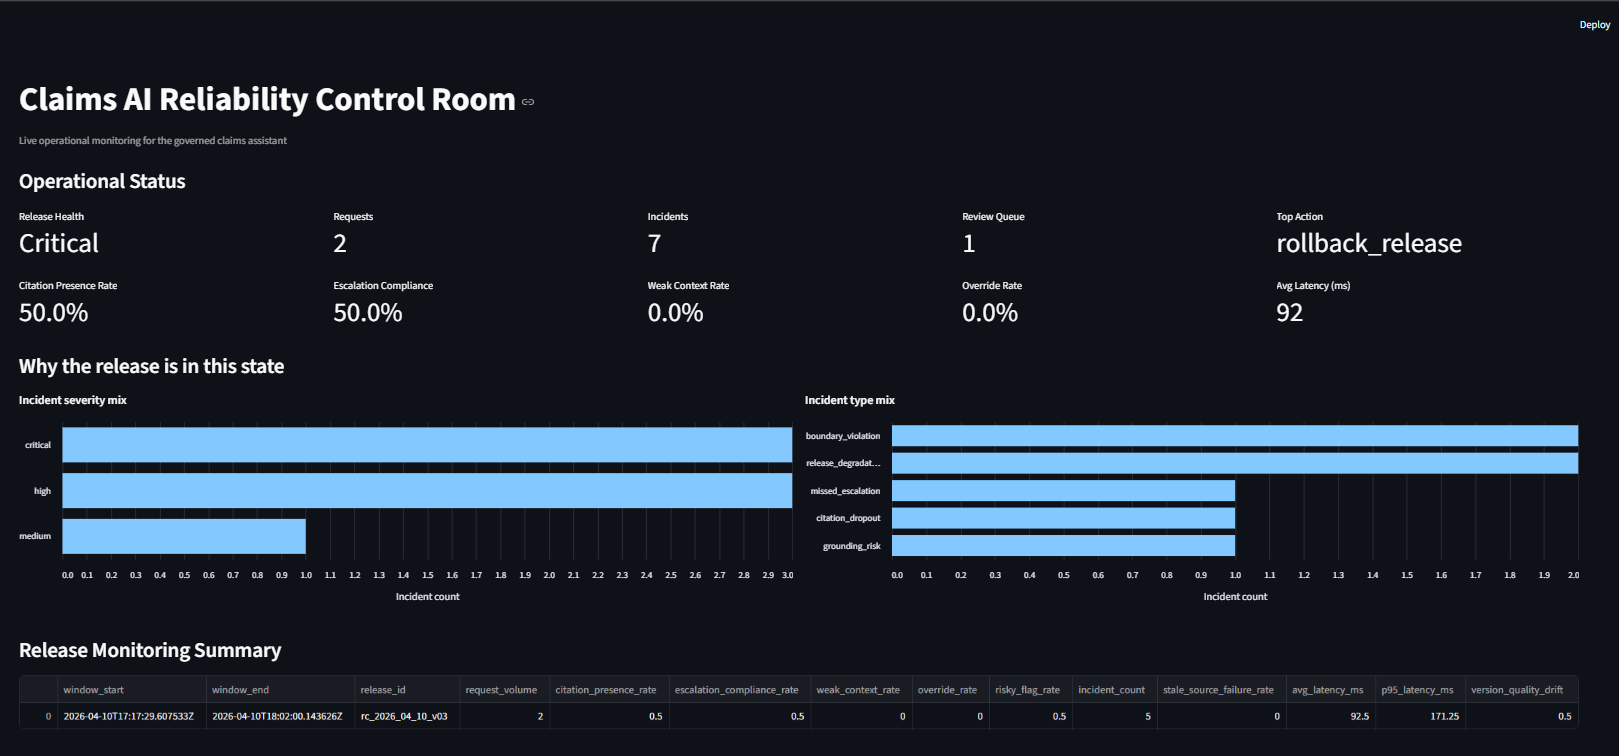
Claims AI Reliability Platform
A production-style AI reliability case built around a harder question than demo quality: when can a claims knowledge assistant be trusted enough to scale, and how should unsafe behavior be detected, reviewed, and rolled back after release?
Business AnalystData Science / AI
Governed release gateReal bug caught and fixedLive monitoring + rollback logic
Applied GenAI / Retrieval / Knowledge Workflow GenAI workflow case
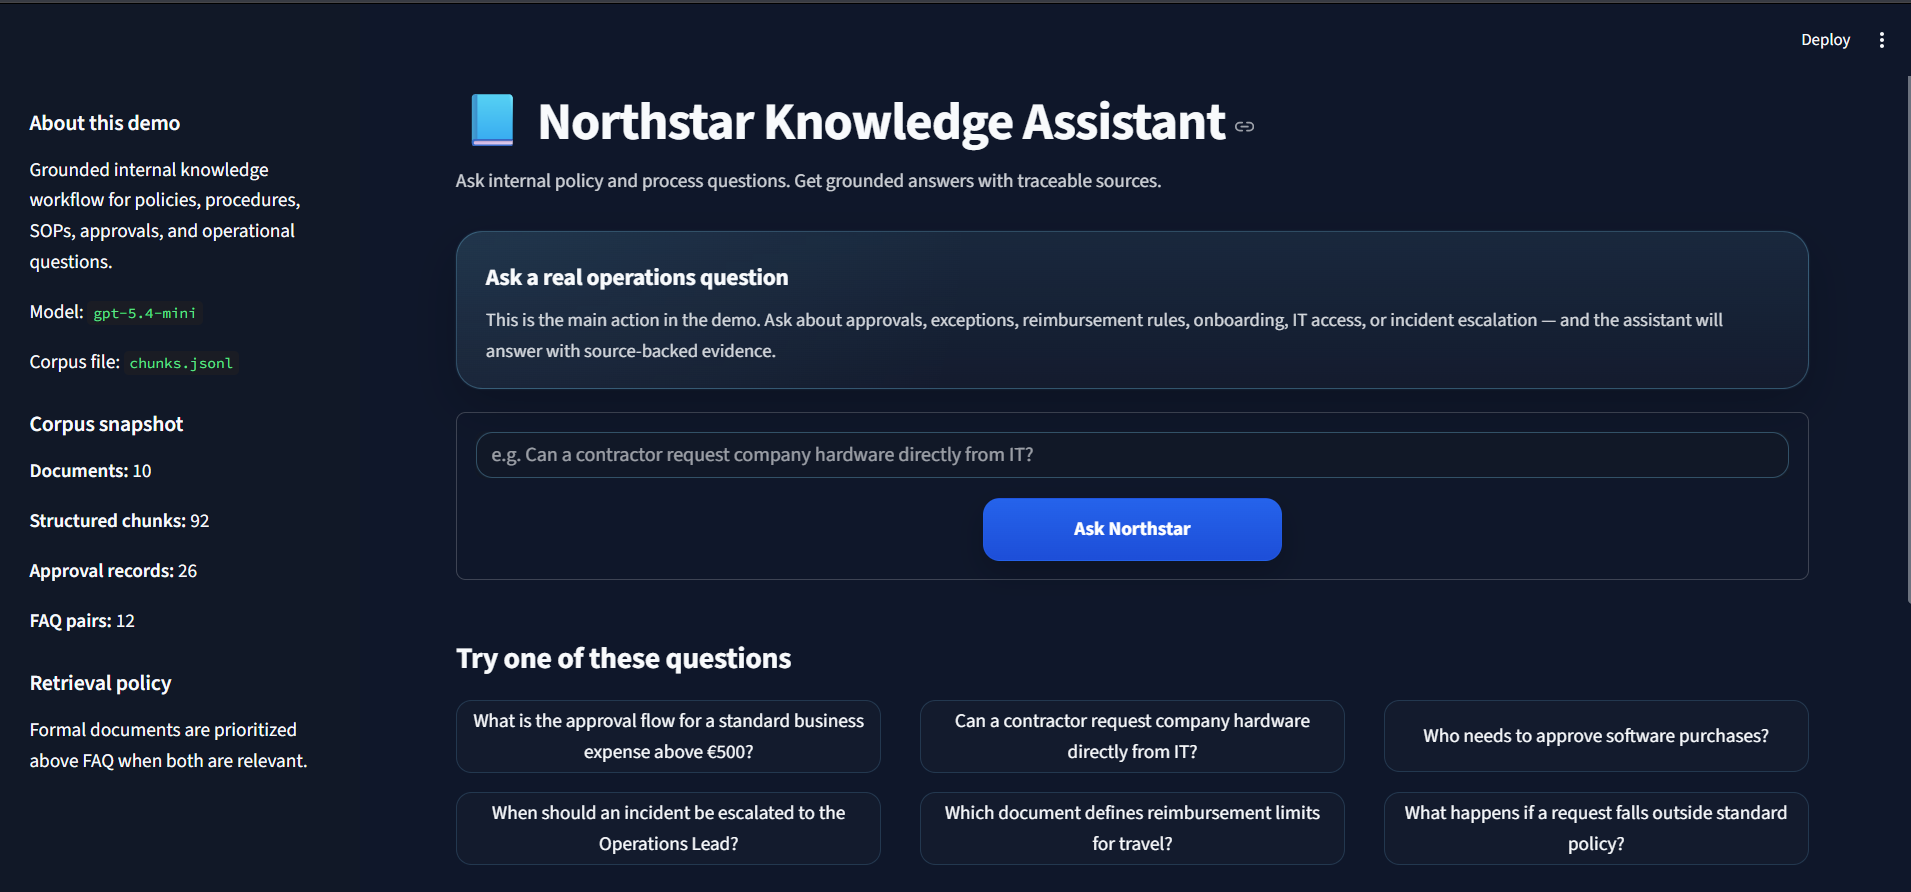
Internal Policy & Process Knowledge Assistant
A grounded GenAI workflow built around a realistic internal operations problem: helping teams get faster, more reliable answers from scattered policies, procedures, approvals, and support documents.
Business AnalystData Science / AI
Grounded answersRetrieval-first workflowSource-backed evidence
Flagship project
From fragmented commercial data to a usable decision-support system for SMEs.
This master’s project was built around a real business need: turning scattered commercial data into a practical system for visibility, analysis, and decision-making.
Designed around an actual business problem rather than a purely academic exercise.
From raw data and validation to dashboarding, analytical outputs, and recommendations.
Created to improve visibility, support action, and make commercial decisions clearer.
The starting point
Different channels, different data, no single decision-support layer.
Sales, customers, and product data were spread across multiple operational sources. The challenge was not only to analyse the data, but to transform it into something structured, reliable, and actually useful for business decisions.
WinOmega ERP PrestaShop eBay Miravia Commercial Reporting
How the system works
One pipeline, one analytical layer, multiple business-facing outputs.
The project combined data ingestion, cleaning, quality control, harmonisation, and analytical modelling into a structured workflow capable of supporting reporting, segmentation, recommendation logic, and decision-ready outputs.
- Data integration across multiple business sources
- Validation and quality-control checks
- Standardised analytical dataset creation
- Customer and commercial analysis
- Dashboard-ready and recommendation-ready outputs

Visual proof
What the system actually produces
Each dashboard view supports a different layer of decision-making: overview, diagnosis, customer understanding, and next-best commercial action.
Business problem
Data existed, but visibility did not.
The project addressed a common SME problem: having commercial data available, but lacking a structured system to convert it into useful visibility and decisions.
Technical execution
More than a dashboard.
It required data engineering, validation logic, analytical modelling, dashboard design, and the creation of outputs that could actually be reused and scaled.
Business value
Designed for action.
The final objective was not just insight generation, but helping a business see more clearly, prioritise better, and act with more confidence.
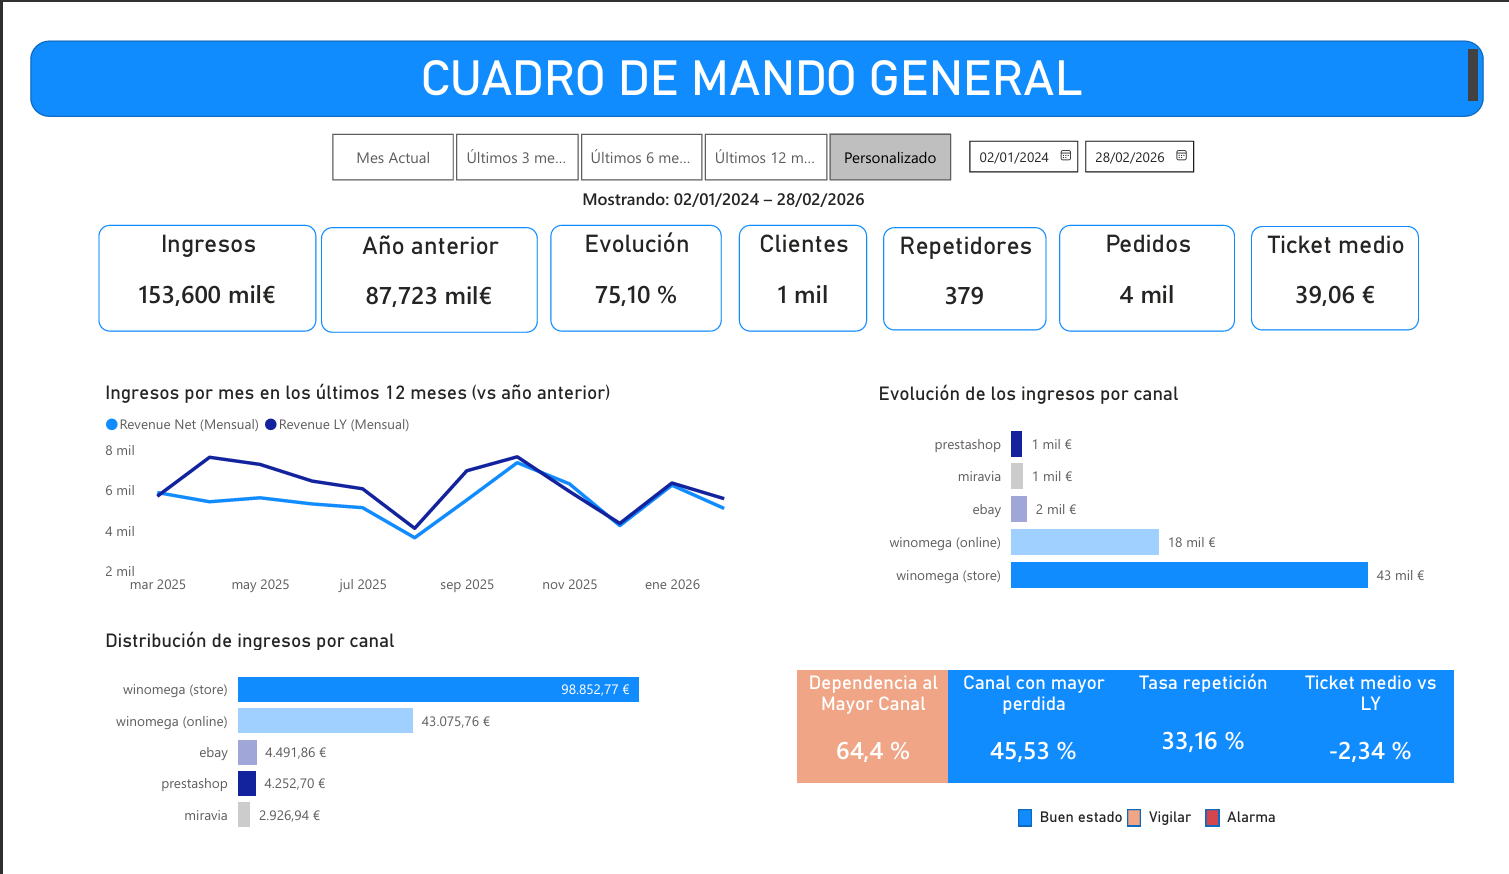
General business overview
A high-level commercial view of revenue, customers, repeat purchasing, ticket size, and channel distribution.